Part II - Spectral Power Distribution
Part III - Metamerism and Color Matching
Part IV - The Optical System of the Human Eye
Part V - Chromaticity Coordinates and the Color Triangle
As discussed previously, we know from experiments that a given color can be matched by mixing three monochromatic lights, called primaries, together in the right amounts (possibly negative). Given three primaries [R], [G], and [B], we can do color-matching experiments with a human observer to find, for each color, the corresponding amounts R, G, and B that match it.
From these tristimulus values, we can calculate the proportions (i.e. relative amounts) required for a match with the following equations:
r = R / (R + G + B)
g = G / (R + G + B)
b = B / (R + G + B)
We call r, g, and b the chromaticity coordinates. They describe the color quality (hue and saturation only) independently of luminance. Note that r + g + b = 1. This means only two of r, g, and b are independent; the third can be calculated from the other two.
An alternative to using R, G, and B to describe a color is to use r, g, and G. Together r and g control the chromaticity, while G controls the luminance. From an rgG color we can derive the b, R, and B values from the above equations as follows:
b = 1 – r – g
R = (r / g) * G
B = G * (1 – r – g) / g
We can represent color-matching data visually with a color triangle. We assign to each point on the plane a particular triple of chromaticity coordinates, according to its position. Then we color each point so that, in the correct lighting, it appears with approximately the color described by its chromaticity coordinates (at some arbitrary fixed luminance).
We must describe how points map to chromaticity coordinates. First, we assign an arbitrary point to each of the three primaries, and label those points with the names of their primaries. The point (R) will correspond to pure light from the R primary and no light from the other two. Similarly for (G) and (B). So we have (R) = (1, 0, 0), (G) = (0, 1, 0), and (B) = (0, 0, 1).
Next, given a point located on a line between two other points, the point's color is mixture of the colors of the other two points, in proportion to how close it is to each. Suppose we have a point (C1) with chromaticity coordinates (r1, g1, b1) and a point (C2) with chromaticity coordinates (r2, g2, b2). Then the chromaticity coordinates of the point (C3) halfway between (C1) and (C2) are:
r3 = ˝ r1 + ˝ r2
g3 = ˝ g1 + ˝ g2
b3 = ˝ b1 + ˝ b2
Figure 5.1
Point (C3) halfway between (C1) and (C2)
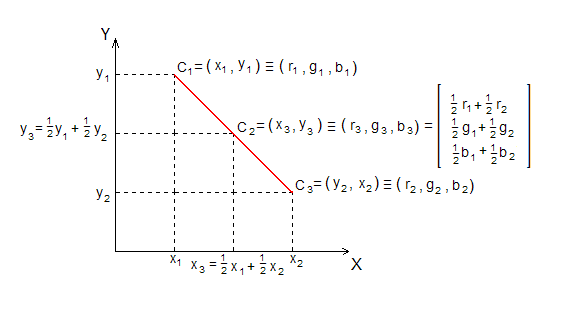
In general, given a point (D1) at (x1, y1) and a point (D2) at (x2, y2), then the point (D3) on the line that connects them, located at p of the way from (D1) to (D2), has the following properties:
Position:
(D3) = (1-p)*(D1) + p*(D2) = ( (1-p)*x1 + p*x2 , (1-p)*y1 + p*y2 )
Chromaticity coordinates:
(D3) = (r3, g3, b3) where r3 = (1-p)*r1 + p*r2 g3 = (1-p)*g1 + p*g2 b3 = (1-p)*b1 + p*b2
Note that colors on the line from (R) to (G) contain no (B) at all. Similarly for the line from (R) to (B) and the line from (G) to (B).
By convention, the point at the center of the triangle, which corresponds to (0.33, 0.33, 0.33), is called W for white. This color may or may not look like our everyday concept of white; it depends on the choice of the primaries (R), (G), and (B). Often these primaries will be deliberately chosen so that W does appear white.
The inside of the triangle does not contain all possible colors. Some colors are located outside the triangle because one of their tristimulus values is negative. Figure 5.2 illustrates this.
Figure 5.2
Color triangle and spectrum locus
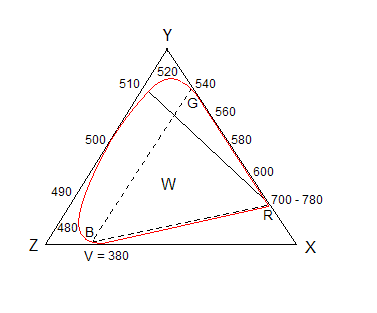
The “shark-fin” curve on the outside of this shape is called the spectrum locus. The points on the spectrum locus correspond to the monochromatic colors of the spectrum. It goes from 780nm at point (R) to 380nm at point (V), just past point (B). The line joining the endpoints (V) and (R) of the spectrum locus corresponds to the pure purples: mixtures of extreme red and extreme violet wavelengths.
Note that the wavelengths are not distributed evenly along the spectrum locus. In fact, the wavelengths from 700nm to 780nm are all located at the single point (R) because the eye is not sensitive enough to distinguish between them.
Note that we could represent chromaticities with all positive coordinates, if we enclosed the graph in a triangle defined by some other primaries XYZ. As we will see, this is what the CIE-XYZ system does.