Back to top
Part II - Wave functions in 1D
This section should be read by high school graduates with the
minimum of grade 12 knowledge of math. Some physics from secondary school will
also be useful for this page. But the author of this website assumes that the
reader carries certain basic knowledge about trigonometry.
GOAL: The main goal of this section is to introduce wave functions in one
dimension while using parameters that have been traditional to physics when
involving light as a wave. (The other properties of light will not be discussed
here as it digresses from the discussion of waves.) In this first section of
wave functions of the first dimension we look at the basic building block; the
function y = cos (x) and it's relations to waves before discussing changes that
can be made to this wave function. Look at the graph below to see what the graph
looks like. (In this case we use radians as the x value.)
We first start off by introducing vocabulary that will help us in our
discussion about wave equations.
CYCLE: A cycle of a periodic function is a part of its graph from any point
to the first point where the graph starts repeating. In the case of the cosine
graph a cycle is repeated every horizontal length of 2  . So one cycle consists
of 2 , 2 cycles consist of 4 , 3 cycles consist of 6 and so on.
. So one cycle consists
of 2 , 2 cycles consist of 4 , 3 cycles consist of 6 and so on.
CRESTS: The peak height of of a periodic function. In the case of cos(x) there is a crest at every n x 2.
WAVELENGTH: This is the horizontal length between two consecutive crests. In the 1st graph just above the wavelength is 2 . In the following functions we will denote wavelenth with the Greek letter lambda ( ).
).
PERIOD: The time it takes to go through one cycle.
VELOCITY: The speed that an object travels with a specific direction. In this case our object is a wave and will be denoted by the letter C.
FREQUENCY: There are two ways to define frequency they are 1) cycles/second or 2) if dealing with radians we would define it as radians per second. The frequency is denoted by the Greek letter omega ( ).
).
AMPLITUDE:This is the vertical distance in which a trough and crest are away from a horizontal line. (Sidenote: A trough is the lowest point in periodic graph.) So for example the Amplitude for a cos(x) graph would be 1, since 1 unit is the distace away from a crest and a trough with the horizontal line being y=0. We denote the amplitude for one dimensional wave graphs with the capital letter A.
Now that we're done all this terminology and Greek letter referencing we can now begin to move onto the more interesting material of wave functions.
Let us suppose that we want the equation of a wave that has not been changed horizontally or vertically at time zero. Then what would it's graph be?
ANSWER: The graph would be y=cos(x) since nothing has changed.
But what if the wave starts to move and in a horizontal direction, what would the new function look like after time t?
ANSWER: It is important to note here that the graph has shifted a certain amount of distance away from the origin. The key word being here is distance. The formula for distance in this case is velocity*time (C*t). So our new graph with just horizontal movement occuring is y=cos(x-Ct) if the wave moves in the positive direction and is y=cos(x+Ct) if the wave moves in the negative direction of the X-axis.
The Following graph shows a horizontal shift of in the positive X-axis direction. The velocity in this case is radians per second and the time for the shift to happen is 1 second.
Now that we know how to shift, is there a way to determine what the cosine function if the wavelength is no longer 2? For example what if we noticed that the the graph has compressed or stretched in the horizontal direction compared to f(x)=cos(x). What would the new wave equation be then?
ANSWER: To determine the new equation we need to know what the new wave length of the graph is. Once we know this information then we can proceed to find the equation of the wave. The equation of the graph that deals with compression and stretching is f(x)= cos[(2/)*x].
If 2 < 1 then the graph is being stretched by a factor of /2 with comparison to the f(x)=cos(x) graph. If it happens that 2 >1 then the opposite occurs and the graph is shrunk by a factor of /2 Let us suppose our new wave function has a wave length of 4, then our function is written as follows. f(x)=cos[(2/4)*x]=cos([1/2]*x).
The following graph shows the difference between cos(x) and cos([1/2]*x)
Say that we are given the function instead of the wave length, can we determine the wave length from such a function?
ANSWER: A simple answer is yes. Let cos(Ax) be our graph, with A > 1, then we have a graph that is compressed by a factor of 1/a, then using the following equation we get the wave length of the graph. 2/=(A), then we isolate then =2/A.
The next thing to tackle is the vertical compresion or stretching of the graph. How is this done?
ANSWER: We put the compression or stretching factor in front of the function. There is a direct relationship when we put this number in front of the cosine function. So for example if we wanted a vertical stretch of 2, then the new function would be f(x)=2cos(x). If we wanted to compress the graph vertically by a factor of 1/2 for the cosine graph then our new function would then become f(x)=(1/2)cos(x).
The following graph shows a stretching and compressing of a cosine graph.
Now that we know the basics of waves and the different equations, we can get fancy and combine two or more together to produce a more sophisticated graph. For example the graph below is f(x)=2cos((1/2)(X-)).

To get the above graph we would shift in the right direction by a value of Pi, then expand horizontally by a factor of 2 and then stretch vertically by the factor of 2 when using the cos(x) graph as the comparison. The graph represents at time t=1.
If you've noticed, none of the equations have used frequency directly. It must be noted that = (2C)/
So our equation can be manipulated into the following form
y=Acos ((2)/)(x-Ct))
y=Acos((2/)x-(2C)/)t)
So now we replace terms and use frequency directly into the function and Voila we get...
y=Acos((2/)x-t)
It should be noted that if we are given two of the following three, velocity, wave length. For example manipulating the formula /2=C
The period can be found by letter T=period and having T=2/
y=Acos((2)x-(2C)/)t)
Back to top
Part III - Affine functions in 2D and 3D
Hmm. Where do we start with this topic? First of all, you need to know what
an affine function is. An affine function is any function that can
be represented as:
f(x) = ax + b,
where a and b are some arbitrary constants and x is a variable. That was the 1D form. In 2D, we add another variable to the equation, and
this changes the function form to:
f(x, y) = ax + by + c,
where c is another arbitrary constant and y is the extra variable that has been
added.In 3D, this equation takes the form:
f(x, y, z) = ax + by + cz + d,
where d is another arbitrary constant and z another variable that we need to
worry about. Now, let's take a look at how these functions behave in 2D (3D functions behave in the
same manner, except that you have to add another dimension to the graph. Since this is
hard to convey on graphs, we will be restricting our discussion to 2D graphs).
We will set f(x) = 0. In the grand scheme of things, this is usually done because we can
always rewrite this equation as C = ax + by where C is the combination of f(x)
and c.
There are many different cases to consider. Let us now take a look at them.
- a = 0
|
|
The equation reduces to by = c. These equations are just horizontal lines.
|

- b = 0
|
|
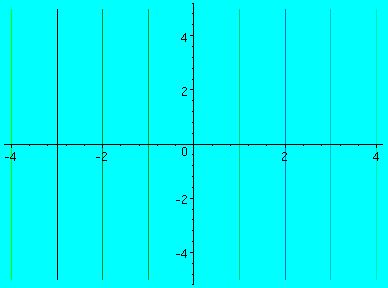
The equation reduces to ax = c. These equations are just vertical lines.
|
- b not equal to 0 and a not equal to 0
|
|
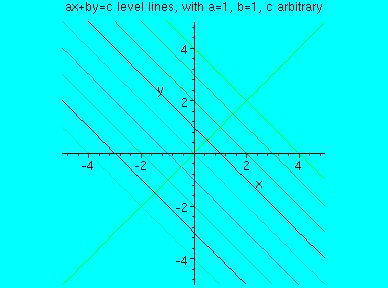
The equation ax + by = C represents level lines that are
neither horizontal nor vertical lines. See below for graphs.
|
- b = 0 and a = 0
|
|
This is a rather trivial case and we will not bother to graph this.
|
Ok, so now we want to express all the above cases in a simpler model. Let's look at
level lines (a level line is a curve where a function has a single value) of the function
ax + by = C
If you look at the equation ax + by = C and set C to 0, then we see that
this is [ a b ].[x y]' = 0, from linear algebra. This means that [x y] is perpendicular
to the vector [a b]'.
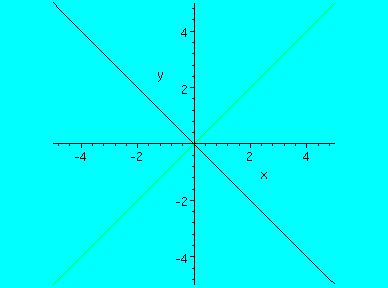
In fact, if we put C back into the equation, we see that all level lines are
perpendicular to [a b]'. In the graph below, [a b] was chosen to be [1 1] as an example.
One thing that is useful and handy to know concerning affine functions - that would be
the distance between level lines in a set (C varies, but [a b] is chosen and stays
constant within the set).
To figure this out, think of the vector [a b] as the distance between level lines.
Calculating the length of the vector would be equivalent to calculating the distance between level
lines! Since the distance from the line ax + by = 0 would be c1 / sqrt( a^2 + b^2 ) (using
our knowledge of vector algebra), the general formula for this would be:
distance = (c2-c1) / sqrt( a^2 + b^2 )
This effectively calculates the distance between level lines. This distance is also
signed (positive or negative), indicating the direction in which the level line lies.
Back to top
Part IV - Waves in 2D and 3D and the Wave Equation
In order to understand waves in multidimensions, namely in 2 and 3 dimensions, we must have a good
grasp of the wave equation in 1 dimension. Please refer to the second section of this page titled "Wave Functions in 1 Dimension".
In the one dimensional case, we have:
1) f(x)=Acos[(2/)*(x-ct)]
A = amplitude, or height of the wave
= 3.14159265358979323846264338327950288419716939937510....
= the wavelength
Whereas in the 2 and 3 Dimensional case respectively, consider
2) f(x,y)=Acos(ax+by-ct)+g
3) f(x,y,z)=Acos(ax+by+cz-dt)+g
In the 2 dimensional case, a and b are the stretching/compressing factors on the axises x and y respectively. (This
equation is actually the wave equation as a function of space x,y and time t.)
Similarly, in the 3 dimensional case, a, b, and c are the stretching/compressing factors on the axises x, y, and
z axises accordingly. (Here, the wave equation as a function of x,y,z and t. This would make it impossible to graph since
it would require using four axises.)
What does it mean by stretching and compressing factors? Let's take a look at the the wave equation in 2D.
Here are some graphs of the 2D equation (in 3D). Remembering what you already know from the section on "Wave Functions
in 1D", apply this knowledge to the 2D case. We have the amplitude A which is going to stretch all values of f(x,y) by a factor of A. If A<1, then the waves will appear shallow, whereas when A>1, the waves will appear to be taller in comparison to the case when A=1.
For a and b >1, points on the x and y axises are compressed by a factor of 1/a and 1/b respectively. However, if a and b <1, then points on the x and y axises are stretched out because of the factor 1/a and 1/b.
At time t=0, f(x,y)=Acos(ax+by) where [a,b] is the vector perpendicular to the waves (level lines) and is a multiple of [a,b]. The signed distance from level 0 to level 2 is 2/[(a^2+b^2)^0.5], also the length of . However, as time increases, the wave moves in the positive xy plane given c is the velocity in the equation
f(x,y)=Acos(ax+by-ct)
However, it would move in the opposite direction in the negative xy plane if c were negative, changing the wave equation to
f(x,y)=Acos(ax+by+ct).
Finally, in the equation f(x,y)=Acos(ax+by-ct)+g, the graph is shifted by a factor of g on the f(x,y) axis.
We would apply similar shifting and scaling techniques for graphs of 3 dimensions if it were at all possible to conceive.
And now, a couple of final animations to leave you with (which mimicks wave-like motion)

Back to top
Collaborators for this site:
Vincent Ng
Laura Yang
Sarah Yang