y = 2 × f (x)
1) Generate a Table of Values for y = 2 × x2
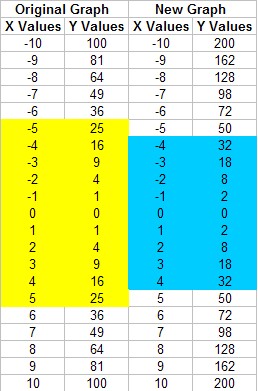
The values shown in yellow are used for the original graph. The values shown in blue are used for the new graph.
2) Plot the Graph of the Original Function and the New Function
3) Compare the Graphs
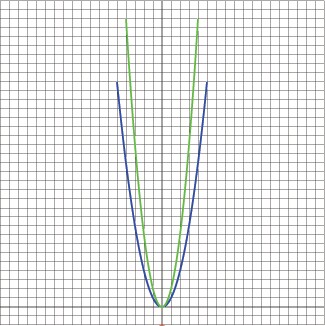
The original graph is shown in blue, and the new graph is shown in green. How does it compare?
Be careful to notice that the green parabola doesn't have the same amount of data points as the blue one. If you compare the values around x = 0, ±1 , ±2 , or ±3 it appears that the new graph is twice the original graph. Its shape has changed, and it looks the somewhat taller.
y = 0.5 × f(x)
1) Generate a Table of Values for y = 0.5 × x2
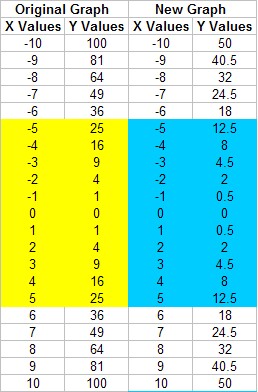
The values shown in yellow are used for the original graph. The values shown in blue are used for the new graph.
2) Plot the Graph of the Original Function and the New Function
3) Compare the Graphs
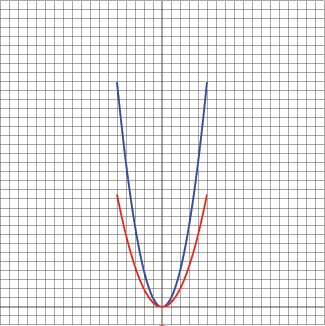
The original graph is shown in blue, and the new graph is shown in red. How does it compare?
In this case, the red graph has the same number of data points as the blue one. It appears that the new graph is only half as high as the original graph. By comparing the table of values, this is more apparent. Its shape is different, but it looks like the original graph and is shorter.