Composite Functions Using Translations -- Example #1

In this section, we will use what we know of translations to graph complex functions from simple ones. We will still use the y = x2 function, but we will apply multiple transformations all at the same time. The graphs following will show the transformations as they are applied one at a time. A greyed out graph shows the previous step and a blue graph shows the current step. Try to follow along as best you can.

General Principles
When you decompose a function and turn it into the sum of its translations, the best strategy is to work from the outside in. Start with the original function,and work with what is in the brackets, and then work outward. The first changes are always related to the x-coodinate; the y coodinate changes come last. The following examples should make it more clear. Dont' forget that f (x) = x2.

Graph of the Function 0.5 [ f(x+4) ] - 1

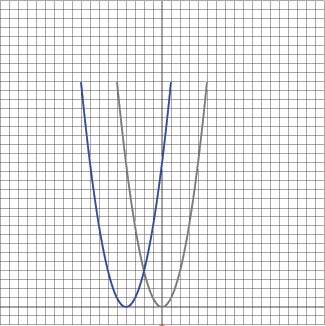
The basic function has a f(x+4) term. This results in a shift of four in the negative direction.

The grey graph shows the original function, and the blue graph shows the current function.
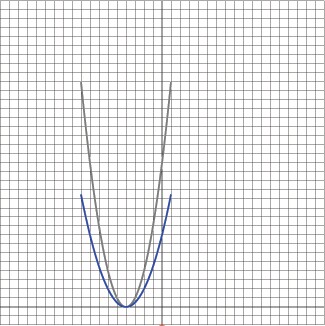
The 0.5 coefficent in front of the f (x+4) causes all the y values to be scaled down 1/2. Compress the graph vertically by this factor.

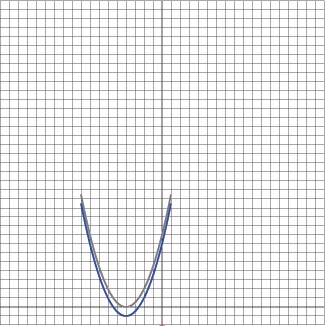
The last - 1 term indicates that all the y values should be shifted down one. Translate the graph 1 unit downward.
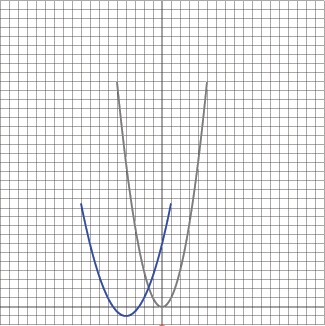
This is a comparison of the original graph and the new translated graph.

On to Composite Function Example Number 2
Back to X-Coordinate Scaling
Back to the Introduction