Stereographic Projection, Chaucer and the Astrolabe
By Laura Jamieson and Maria Montero
What do Stereographic Projection, Climates, and Geoffrey Chaucer have in common?
They are all, in one way or another, related to the Astrolabe. But what exactly is an astrolabe? What is stereographic projection? What is a climate and what does Chaucer have to do with them? This project attempts to provide the basic answers to these questions through the use of pictures, proofs, and commentary. To organize all this information, we have divided the project into four main parts:
Part 1 What is an astrolabe? (This explains what a climate is too!)
 Part 2 What is stereographic projection? (Includes a proof that stereographic projection preserves circles) Part 2 What is stereographic projection? (Includes a proof that stereographic projection preserves circles)
Part 3 Using stereographic projection to make an astrolabe’s climates.
Part 4 A bit of Chaucer’s treatise on the astrolabe (loosely translated and with some commentary)
We also include the sources we’ve used as references as well as some related and interesting web sites for you to check out if you want to know more about any of these topics. So, without further ado...
Part 1
What is an astrolabe?
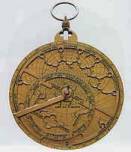
Of all astronomical instruments, The Astrolabe was the most widely used throughout the middle ages. It was developed in ancient Greece for measuring the altitude of a heavenly body, but gained popularity all over the world until the sextant replaced it in the 18th century. It provided a means to mark the time of day and the seasons of the year as well as  finding the angle of the sun, moon, stars and planets with respect to the horizon or the zenith. It was used for calculating the heights of buildings and mountains and for surveying the land. The Astrolabe was also used as a way of reading one’s horoscope and a way for navigators to locate their longitudinal and latitudinal coordinates. Basically, it was a pocket watch, compass, fortune-teller, crude sextant, and theodolite all in a convenient little palm-sized case! The most common form of the astrolabe was the planispheric astrolabe, which was also the easiest to use. This marvelous invention, often made of brass, was approximately 5 to 10 inches in diameter and included a horse, a rete, climates or plates, the mater, the alidade, vane and pin. finding the angle of the sun, moon, stars and planets with respect to the horizon or the zenith. It was used for calculating the heights of buildings and mountains and for surveying the land. The Astrolabe was also used as a way of reading one’s horoscope and a way for navigators to locate their longitudinal and latitudinal coordinates. Basically, it was a pocket watch, compass, fortune-teller, crude sextant, and theodolite all in a convenient little palm-sized case! The most common form of the astrolabe was the planispheric astrolabe, which was also the easiest to use. This marvelous invention, often made of brass, was approximately 5 to 10 inches in diameter and included a horse, a rete, climates or plates, the mater, the alidade, vane and pin.
Parts of the Astrolabe
As stated above, the astrolabe was made up of a horse, rete, some climates, the mater, the alidade, a vane, and a pin.
The Mater was the main frame of the astrolabe and on it sat the climates, rete and horse. It was disk shaped and often had a hook or loop at one end so that the astrolabe could hang on a chain. The climates, or plates, which sat on top of the mater, were discs that had lines etched onto them. A person using an astrolabe would use different climates depending on their location on the earth. The rete sat above the climates and had specific pointers on it that would point out particular lines on the climate below it. The rete was free to rotate about a central pin that ran through the center of the mater, climates, and rete and was held in place above the rete by a horse, which was so named because it  was usually made in the shape of a horse’s head. In addition to the climates, the mater itself would often have latitudinal lines etched onto its top side and on the backside all the information an observer would need concerning the degree of altitude, signs of the zodiac, months of the year, and days of the month were etched onto the mater. The information of a particular celestial body would be identified by the alidade (also called the double rule). The alidade sat directly below the mater and was basically a slide-rule with sighting holes at each end so that a particular body could be focused on. The alidade allowed the observer to calculate the altitude of the object seen within the sighting holes as well as discern the zodiac sign for the object by rotating beneath the mater and identifying the relevant information etched on the backside of the mater. Although the individual parts of the Astrolabe are simple, put together, the components of the Astrolabe create a highly versatile and indispensable instrument. was usually made in the shape of a horse’s head. In addition to the climates, the mater itself would often have latitudinal lines etched onto its top side and on the backside all the information an observer would need concerning the degree of altitude, signs of the zodiac, months of the year, and days of the month were etched onto the mater. The information of a particular celestial body would be identified by the alidade (also called the double rule). The alidade sat directly below the mater and was basically a slide-rule with sighting holes at each end so that a particular body could be focused on. The alidade allowed the observer to calculate the altitude of the object seen within the sighting holes as well as discern the zodiac sign for the object by rotating beneath the mater and identifying the relevant information etched on the backside of the mater. Although the individual parts of the Astrolabe are simple, put together, the components of the Astrolabe create a highly versatile and indispensable instrument.
The Climates of the Astrolabe
One of the most important components of the Astrolabe are its climates. As mentioned above, the particular climate used by an observer depends on the location of the observer, and different climates are used in different locations. A typical climate would be a disc, most likely made of brass with a diameter only slightly smaller than that of the mater. It would be thin and several climates could be stacked on top of one another within the mater, and lines would be etched onto its surface. You may be wondering what these lines are. These lines, depending on the particular climate being looked at, may be representations of lines of latitude (such as the equator or tropic of Capricorn or tropic of cancer etc.) or they may be representation of almucantars, lines of azimuth, or hour angles. Almucantars are, like lines of latitude, "imaginary" rings on the earth but unlike latitude lines almucantars are concentric around the zenith of the observer and are parallel to the horizon. Thus, depending on your position in the world, almucantar lines would change and  thus you would need to use a different climate. Also found on a climate may be etchings representing lines of azimuth. Lines of azimuth are imaginary lines that run from an observer’s zenith to the horizon, intersecting the almucantars at right angles. The final etchings that may be found on the plates are the Hour Angles. Hour Angles divide the twenty-four hour day into sections of a circle, assuming that both day and night are made up of twelve hours each. These lines run from the north celestial pole to the equator but when projected onto a climate, only the portions below the horizon are represented.
An important question to ask is "How do we turn these imaginary lines on the earth into real lines on a climate and how do we represent them accurately?" The answer to this question is Stereographic Projection. thus you would need to use a different climate. Also found on a climate may be etchings representing lines of azimuth. Lines of azimuth are imaginary lines that run from an observer’s zenith to the horizon, intersecting the almucantars at right angles. The final etchings that may be found on the plates are the Hour Angles. Hour Angles divide the twenty-four hour day into sections of a circle, assuming that both day and night are made up of twelve hours each. These lines run from the north celestial pole to the equator but when projected onto a climate, only the portions below the horizon are represented.
An important question to ask is "How do we turn these imaginary lines on the earth into real lines on a climate and how do we represent them accurately?" The answer to this question is Stereographic Projection.
Part 2
What is a stereographic projection?
There are many different ways of rendering three-dimensional objects into two dimensions. Different kinds of projections are able to represent realistically things like size, areas, distances, and perspective. One particular kind of projection used for representing spheres and circles on spheres in two dimensions (ie on the climates of an astrolabe, or on some maps of the earth or celestial sphere) is stereographic projection. Stere(o) hails from the Greek "stereos" for "solid", while graphic comes from the Greek "graphicus" meaning "formed by writing, drawing, or engraving". Also, a projection is defined by Webster’s Dictionary as "a systematic presentation of intersecting coordinate lines on a flat surface upon which features from the curved surface of the earth or the celestial sphere may be mapped". Thus stereographic projection involves the rendering of solid, or three-dimensional objects onto a two dimensional page.
What makes stereographic projection so apropos for spheres? Well, stereographic projection has two important characteristics that differentiate it from other kinds of projections:
- Stereographic Projection preserves circles
- Stereographic Projection preserves angles
 This means that circles on a sphere (i.e. latitudes on the Earth) are represented as circles on a plane and the angles between lines are retained when the lines are projected. This is how the climates of the astrolabe are created. The lines of latitude, almucantar, azimuth, and hour angles are represented stereographically onto a plane (usually taken is the equatorial plane) and the climates are merely a scaled-down representation of this. This means that circles on a sphere (i.e. latitudes on the Earth) are represented as circles on a plane and the angles between lines are retained when the lines are projected. This is how the climates of the astrolabe are created. The lines of latitude, almucantar, azimuth, and hour angles are represented stereographically onto a plane (usually taken is the equatorial plane) and the climates are merely a scaled-down representation of this.
How does the projection work?
In regular perspective a point in three dimensions, say P = (x, y, z) is mapped to two-dimensions on the (x,y) plane with the following coordinates: P* = ( ax/a-z , ay/ a-z) where a is the distance position along the z axis where the eye sits (i.e. where one is looking from).
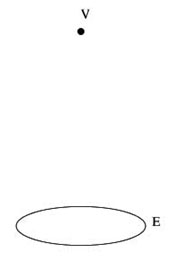
If we let the eye sit at (0, 0, 1) and take a sphere with radius 1 centered at ( 0, 0 , 0), and the x-y plane, then the x-y plane will divide the sphere into two hemispheres. Notice that the point (0,0,1), where the eye sits, would be mapped to the point (0/0, 0/0) and thus would be represented at ¥ and all points near this would be mapped very far away.
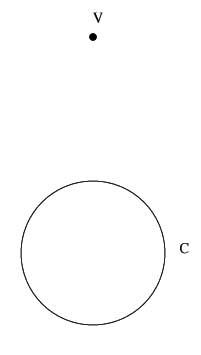
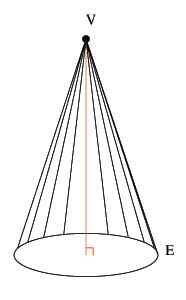
So, let us now take any sphere and mark off the poles on the sphere, which are diametrically opposite to one another. Next we identify the plane "E" which divides the sphere into two equal hemispheres and whose normal runs through both the poles. Now we take any point P on this sphere (except the poles which we know map to infinity) and we want to project this point P onto the plane "E" we defined above. We draw a line that contains a pole, the point P itself, and the plane E and where this line intersects with E we call P*.
So in our example above with the unit sphere centered at the origin, if we took the point P = (x, y, z) on the sphere and then take the south pole which has coordinate (0, 0 ,-1) we can parameterize the line that runs through both these points as:
Pole + t(P - Pole) = (0,0,-1) + t( x,y,z - 0,0,-1)
= (0,0,-1) + (tx, ty, tz + t)
= (tx, ty, -1+ tz + t).
So, when this line intersects the x-y plane (ie z =0) and t = 1/z + 1and so using this formula for t, our point is mapped to:
P* = (x', y', 0) where x' = tx = x/ z + 1
and
y' = ty = y / z + 1
To map circles then we would simply take points on the circle and apply the same procedures.
Proof that stereographic projection preserves circles
As mentioned above, stereographic projection has two important characteristics. One being that stereographic projection preserves angles and the other being that stereographic projection preserves circles. We now include a proof of this fact done in illustrations as well as an algebraic proof.
Algebraic Proof:
Note that a unit sphere with center at origin has the equation:
X2 + Y2 + Z2 = 1 ( 1)
Also, A given plane will have the equation:
AX + BY + CZ + D = 0 (2) Where A,B,C,D are constants
So, if we have a point on the sphere which satisfy (1) we have:
P = ( X, Y, Z)
The projection of P onto the x-y plane will be given by:
P* = (x ,y,0)
The equation of a pole is:
Pole = (0, 0 , 1)
So, one way of representing the line that runs through all of P, P*, and Pole is:
P - Pole = t( P* - Pole) -> ( X, Y, Z - 1) = t( x, y, -1) (3)
From Equation (3) we can see that:
X = tx, Y =ty, Z = 1 - t (4)
We define a circle Q on the sphere in this way:
Q = x2 + y2
Substituting the values from (4) we see
Q = (X / t )2 + (Y / t)2
= X2 + Y2 = 1 - Z2 = 1 + Z (5)
t (1 - Z)2 1 - Z
Also, substituting the value of Z from (4) into equation (5) we get
Q + 1 = 2 / t (6)
And...
Z = Q -1 (7)
Q + 1
Now we want to know what all this will look like on the plane:
AX + BY + CZ + D = 0
We substitute our values for X, Y. Z that we got from (4) and (7)
Atx + Bty + C (Q -1) + D = 0
Q + 1
We replace t by what we know from (6) and get
2Ax + 2By + C (Q -1) + D = 0
Q + 1 Q + 1 Q + 1
Simplifying gives:
2Ax + 2By + C (Q - 1) + D( Q + 1) = 0
2Ax + 2By + CQ - C + DQ + D = 0
(C + D)Q + 2Ax + 2By - C + D = 0
Substituting our original Q gives us
(C + D)(x2 + y2) + 2Ax + 2By - C + D = 0 (8)
Since the coefficient of both x2 and y2 are the same, then equation 8 is the equation of a circle and so the projection of the circle Q onto the plane is a circle.
Geometric Proof:
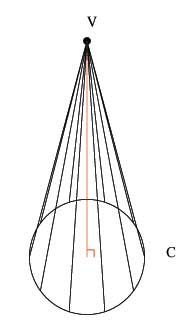
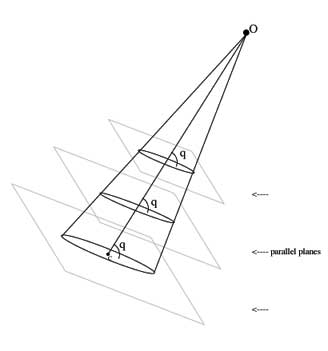
The geometric proof relies on the fact that if a plane intersects a cone at an angle q with respect to the axis of the cone, and this intersection produces a circle, then if a plane was to intersect the cone at an angle 180o - q that intersection would also produce a circle. If we can then show that the stereographic projection of a circle on a sphere makes an angle of 180o - q with respect to the axis of a cone, then we will know that the projection is also a circle.
The pictorial proof begins with certain definitions of particular kinds of cones.
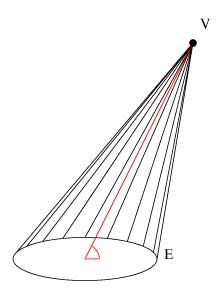
The first kind of cone is the circular cone, which is formed with a point and a circle. The circle is the base of the cone and the point is the vertex. If the axis of the cone (the line joining the center of the circle to the vertex is at right angles with the plane of the circle then the cone is said to be "right circular" and if not then it is "oblique circular".
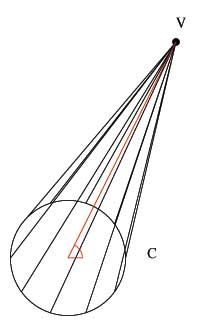
The second definition is for elliptical cones, which are similar to circular cones except that instead of the base of the cone being a circle, it is an ellipse.
The next important point needed to begin the proof is that the intersection of any oblique circular cone is an ellipse
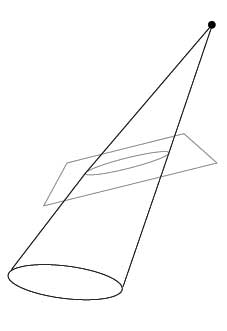
and thus any oblique circular cone can be represented as an elliptical cone. Why? Well, take an oblique circular cone Q, with circle b and vertex V, and the origin be the center of the circle
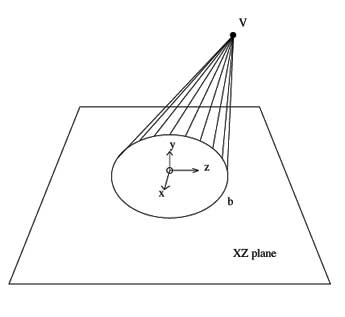
Note that the cone Q is symmetric around the YZ plane:
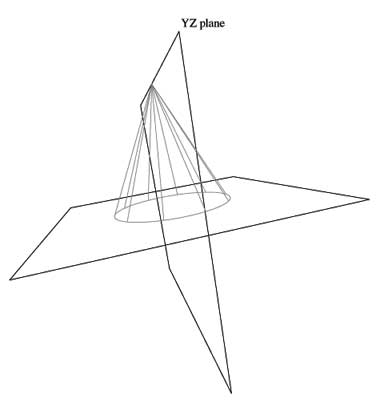
Place Points T,C, V and S as follows: All these lie on the YZ plane, and pick S such that SV=VT and C is the midpoint of ST.

Any plane passing through ST and perpendicular to YZ will intersect Q in an ellipse, therefore Q is an elliptical cone with axis VC according to Definition 2

How does this relate to our projection from a sphere?
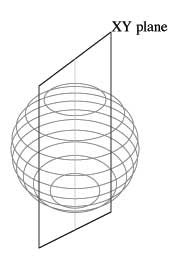
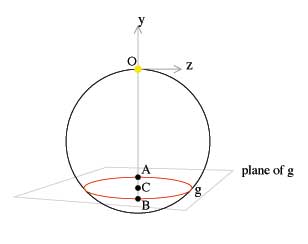
With these important ideas clearly established, the proof begins with a sphere situated such that the origin, O, is at the North Pole. On the surface of the sphere is a circle called g. If light is shone from the origin, the rays of light and the circle g form a circular cone and from the above proof this circular cone can be considered an ellipse.
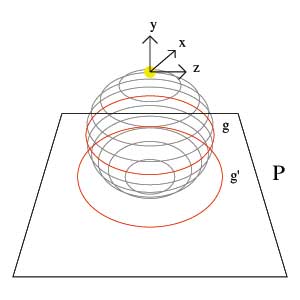
Let the rays of light from the origin through the circle g by a circular cone. We know from above that this cone can be considered elliptical
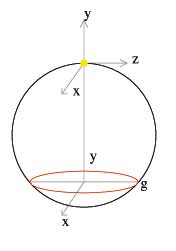
g is symmetric about the XY plane
So, our original circle intersects the elliptical cone made by the light at an angle q with respect to OC.
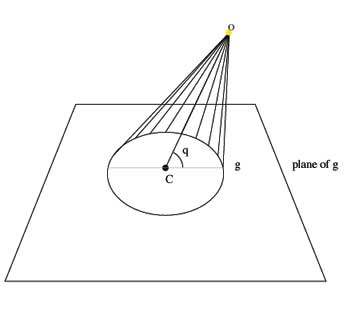
And no matter where you cut, as long as the angle is q, the result is always a circle:
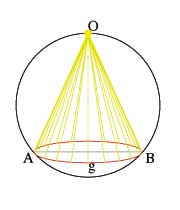
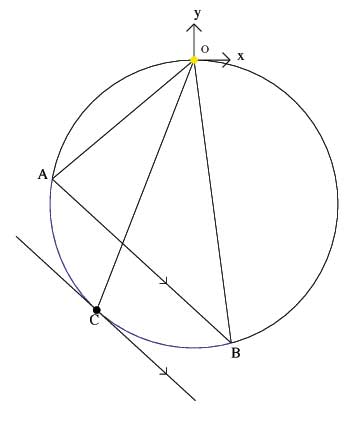
Since the circle is symmetric about the XY plane, we can see that when the sphere intersects the XY plane
we will have a circle with a chord that corresponds to the diameter of our original circle (AB).

We can find the midpoint of the arc AB and call this C.
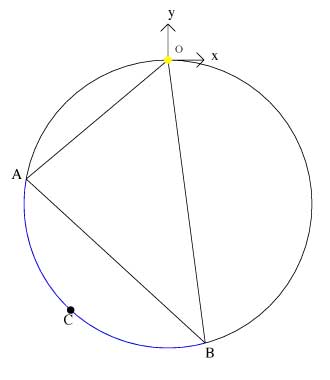
We see that if O is the origin, OC bisects the < AOB and is the axis of the cone.

As can be seen, the diameter of the circle is AB and C is the midpoint of the arc AB and so OC bisects the < AOB.
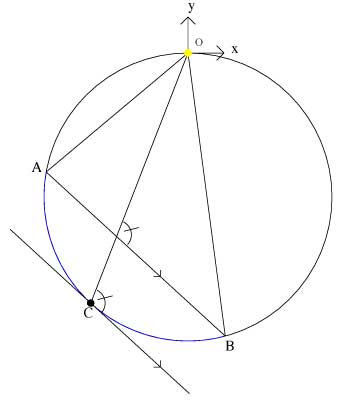
Another plane that also produces a circle is the plane that is 180o-q:

If we can show that the projection plane is at an angle 180o-q to OC then the projection will be a circle.
At this point we use the identity that inscribed angles opening to the same arc are equal, and the proof can be simplified into two dimensions:
Draw a tangent at C, and it will be parallel to AB:
And therefore corresponding angles are equal, so < OCP = q.
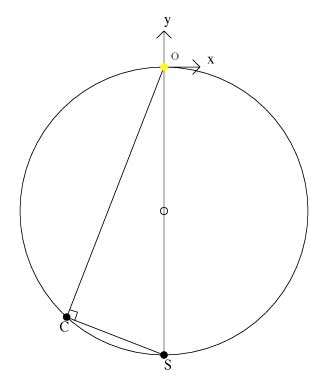
Now we draw S as the point diametrically opposite to the origin, making OS a diameter and P is the intersection of the tangent line at C and the tangent line at S.
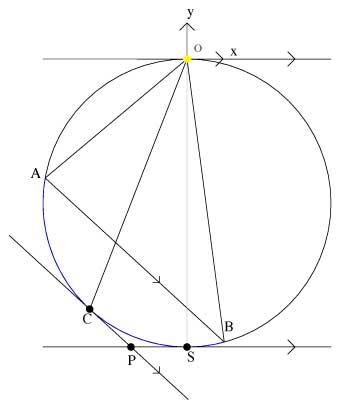
From the picture we see that < OCS is an inscribed angle in a semi-circle and is therefore equal to 90o
but q = < OCP = < PCS + 90o
PS and CP are both tangent to the circle coming from the same external point P, so PC = PS and therefore < PCS = < PSC
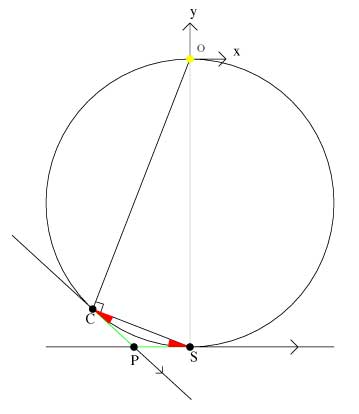
f is the angle between the tangent line at point S and the line OC extended out of the circle. From the pictures we can see that q = < PCS + 90o or since f = 90o - < PSC then q = 180o - f.

The projection plane can be shown to be f which is 180o - q and so the projection is a circle.
Thus we have seen what stereographic projection is, how it works and some proofs of its very important property of preserving circles, now we can use stereographic projection to create some of our own Astrolabe climates!
Part 3
Making Climates
As previously described, the climates of an astrolabe contain lines that represent latitudes, almucantars, lines of azimuth, or hour angles. Below are representations of these four types of imaginary lines as inspired by illustrations from J.D. North's article entitled "The Astrolabe" from Scientific American.
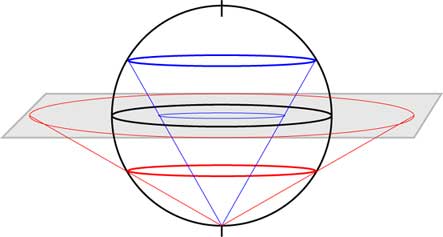
Lines of Latitude:
The easiest and probably most important lines of latitude are the Equator, the tropic of Cancer and the tropic of Capricorn. These three circles are depicted and the plane of projection is taken to be the equatorial plane. Lines connect the circles to the South Pole and their intersection with the plane produce the stereographic projection. The image below is a representation of the earth and below that, what a climate may have looked like depicting the Equator, Tropic of Cancer and Tropic of Capricorn.

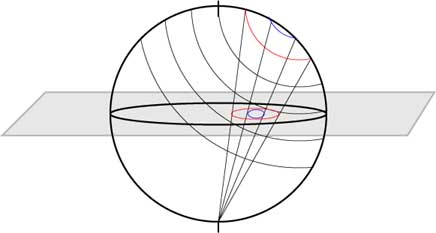
Almucantars:
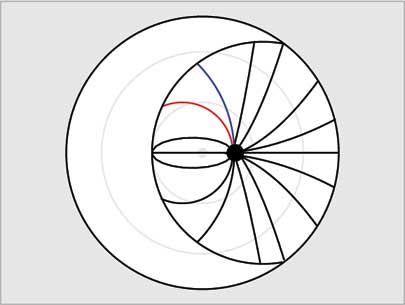
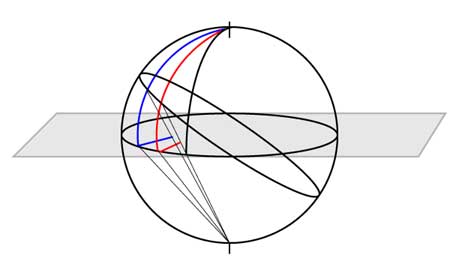
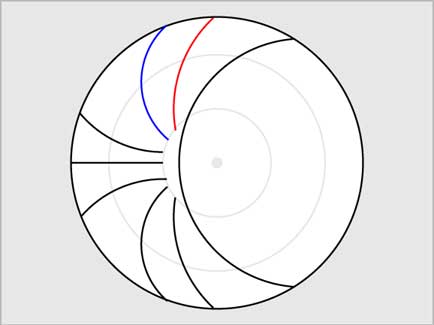
For this particular representation, we take the observer's zenith to be 40o north of the equator and the horizon to be the last ring in the picture. The projection of two rings are specifically shown in red and blue and the total projection as it would have appeared on a climate is below.
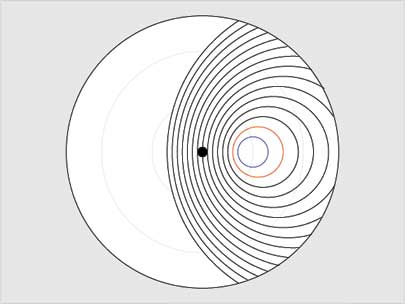
Lines of Equal Azimuth:
Here we take angles at 90o (blue arc) and 60o (red arc) and focus on these. Lines of azimuth were only represented above the line of horizon and so these azimuth lines are cut off by the horizon ring. The climate projection is again show below the represented earth.

Hour Angles:
Hour angles we drawn only beneath the horizon line although they extended all way to the North Pole. These lines mark the hours of the day: twelve for day and twelve for night... we only represent one set in this picture.
Part 4
What’s Chaucer got to do with it?
We’re finally nearing the end of this project, but the important question still remains, what does Geoffrey Chaucer, author of The Canterbury Tales, Troilus and Criseyde and many other works, have to do with the astrolabe?
Well, as mentioned in the introduction, the astrolabe was an extremely popular instrument during the Middle Ages, which lasted (depending on who you talk to) from about the 4th century to the end of the 14th century A.D. Chaucer just happened to have been born and lived about this time (1343? - 1400) and so, as a learned man of some means (he was a government official, customs officer, justice of peace and was elected to Parliament), he would have been fairly familiar with the astrolabe.
In 1391, Chaucer wrote a work entitled "A treatise on the Astrolabe". The introduction of the work would imply that it was written for his son, however it may have been written instead for the son of a friend, Lewis Clifford. Whoever it was written for, the boy most likely died in 1391, which is why Chaucer’s work was never finished. "A treatise on the Astrolabe", according to the F.N. Robinson edition, is the oldest known "technical manual" in the English Language and it was compiled from different foreign sources. The introduction, which we have reproduced below, is however, Chaucer’s very own. Included with the original introduction is an extremely loose translation (the emphasis here is on loose!) of it into modern English:
Lyte Lowys my sone, I aperceyve wel by certeyne evydences thyn abilite to lerne sciences touching nombres and proporciouns; and as wel considre I thy besy praier in special to lerne the tretys of the Astrelabie. Than for as mochel as a philosofre saith, "he wrappith him in his frend, that condescendith to the rightfulle praiers of his frend," therfore have I latitude of Oxenforde; upon which, by mediacioun of this litel tretys, I purpose to teche the a certein nombre of conclusions aperteynyng to the same instrument. I seie a certein of conclusions, for thre causes. The first cause is this: truste wel that alle the conclusions that han be founde, or ellys possibly might be founde in so noble an instrument as is an Astrelabie ben unknowe parfitly to eny mortal man in this regioun, as I suppose. An-other cause is this, that sothly in any tretis of the Astrelabie that I have seyn there be somme conclusions that wol not in alle thinges parformen her bihestes; and somme of hem ben to harde to thy tendir age of ten yeer to conceyve.
This tretis, divided in 5 parties, wol I shewe the under full light reules and naked wordes in Englissh, for Latyn ne canst thou yit but small, my litel sone. But natheles suffise to the these trewe conclusions in Englissh as wel as sufficith to these noble clerkes Grekes these same conclusions in Grek; and to Arabiens in Arabik, and to Jewes in Ebrew, and to the Latyn folk in Latyn; whiche Latyn folk had hem first out of othere dyverse langages, and writen hem in her owne tunge, that is to seyn, in Latyn. And God woot that in alle these langages and in many moo han these conclusions ben suffisantly lerned and taught, and yit by diverse reules; right as diverse pathes leden diverse folk the righte way to Rome. Now wol I preie mekely every discret persone that redith or herith this litel tretys to have my rude endityng for excusid, and my superfluite of wordes, for two causes. The first cause is for that curious endityng and hard sentence is ful hevy at onys for such a child to lerne. And the secunde cause is this, that sothly me semith better to writen unto a child twyes a god sentence, than he forgete it onys.
And Lowys, yf so be that I shewe the in my light Englissh as trewe conclusions touching this mater, and not oonly as trewe but as many and as subtile conclusiouns, as ben shewid in Latyn in eny commune tretys of the Astrelabie, konne me the more thank. And preie God save the king, that is lord of this langage, and alle that him feith berith and obeieth, everich in his degre, the more and the lasse. But considre wel that I ne usurpe not to have founden this werk of my labour or of myn engyn. I n’am but a lewd compilator of the labour of olde astrologiens, and have it translatid in myn Englissh oonly for thy doctrine. And with this swerd shal I sleen envie.
Prima pars. -The firste partie of this tretys shal reherse the figures and the membres of thyn Astrelabie by cause that thou shalt have the gretter knowing of thyn owne instrument.
Secunda pars. -The secunde partie shal techen the worken the verrey practik of the forseide conclusiouns, as ferforth and as narwe as may be shewed in so small an instrument portatif aboute. For wel woot every astrologien that smallist fraccions ne wol not be shewid in so small an instrument as in subtile tables calculed for a cause.
Tertia pars. -The thirde partie shal contene diverse tables of longitudes and latitudes of sterres fixe for the Astrelabie, and tables of the declinacions of the sonne, and tables of longitudes of citees and townes; and tables as well for the governaunce of a clokke, as for to fynde the altitude meridian; and many anothir notable conclusioun after the kalenders of the reverent clerkes, Frere J. Somes and Frere N. Lenne.
Quarta pars. -The fourthe partie shal ben a theorike to declare the moevyng of the celestiall bodies with the causes The whiche fourthe partie in speciall shal shewen a table of the verrey moeving of the mone from houre to houre every day and in every signe after thyn almenak. pon which table there folewith a canoun suffisant to teche as wel the manere of the worchynge of the same conclusioun as to knowe in oure orizonte with which degre of the zodiak that the mone arisith in any latitude, and the arisyng of any planete after his latitude fro the ecliptik lyne.
Quinta pars. -The fifthe partie shal be an introductorie, after the statutes of oure doctours, in which thou maist lerne a gret part of the generall rewles of theorik in astrologie. In which fifthe partie shalt thou fynden tables of equaciouns of houses after the latitude of Oxenforde; and tables of dignitees of planetes, and othere notefull thinges, yf God wol vouche saaf and his Moder the Maide, moo then I behete.
Now heres a rough (very very very rough) and somewhat edited translation of the above introduction:
Little Lewis, my son, I can well appreciate, by certain evidences, your ability to learn the science of numbers and proportions and I consider it in your best interest to learn the traits of the Astrolabe...
Through this little treatise I propose to teach you some conclusions (pertaining to the astrolabe) for three reasons. The first is that there is no one else in the area that knows as much (as me) about the instrument, the second is that other treatises of astrolabes contain conclusions that may not always be true, and finally some treatises will be above your ability to comprehend, for example written in other languages.
This treatise is divided into 5 parts, which I will write in English because you don’t know Latin... (Chaucer speaks for a bit about different languages and how each speaker wrote in his own language, as he is about to do, to benefit his people. He apologizes a bit for the excess of words for he means to make this treatise as clear as possible for a child to learn. He then says that it is better that "he write, for a child, a twice good sentence than if the child forgot it once". Chaucer then goes on to end his letter’s introduction... "God save the king"... and finally he begins his outline)
Part1: the first part of the treatise will cover the parts and components and of your astrolabe so that you may be familiar with your instrument.v
Part2: shall teach the practical workings of your astrolabe and useful conclusions that may be drawn from it and the use of the tables for calculations etc.
Part3: shall look at the tables of longitudes and latitudes of fixed stars for the astrolabe, the tables for the movement of the sun and the tables of longitudes for fixed cities and towns as well as table for telling time, finding altitude and many other notable conclusions about the calendars.
Part4: shall deal with theories on moving celestial bodies and in particular a table of the true moving of the moon from hour to hour and every day and in every sign in your almanac. Also to teach as well the way of finding in our own horizon and what degree of the zodiac the moon is in and in what latitude and also the rising of any planet and its latitude in the ecliptic plane.
Part5: an introduction in the general rules of theory in astrology. You will also find tables of equations and tables for the planets and for the town of Oxford and other useful things.
God keep you safe and so I begin...
Chaucer then begins part 1 of his treatise, which is, as noted above, a description of the parts of the astrolabe. Our own description of the parts of the astrolabe in this project is fairly similar to Chaucer’s description although Chaucer was no doubt holding an astrolabe as he was writing it. Interspaced among the descriptions of the parts of the astrolabe are reminders and advice for "Litel Lowys", the proper way to use it, hold it, and keep it safe.
Part 2 of the treatise involves instructions for common uses of the astrolabe. The first three such instructions are included below as well as the translation:
1. To fynde the degre in which the sonne is day by day, after his cours aboute.
Rekne and knowe which is the day of thy month, and ley thy rewle up that same day, and than wol the verrey poynt of thy rewle sitten in the bordure upon the degre of thy sonne.
Ensample as thus: -The yeer of oure Lord 1391, the 12 day of March at midday, I wolde knowe the degre of the sonne. I soughte in the bakhalf of myn Astrelabie and fond the cercle of the daies, lo the whiche I knowe by the names of the monthes writen under the same cercle. Tho leyde I my reule over this forseide day, and fond the point of my reule in the bordure upon the firste degre of Aries, a litel within the degre. And thus knowe I this conclusioun.
Anothir day I wolde knowen the degre of my sonne, and this was at midday in the 13 day of December. I fond the day of the month in manere as I seide; tho leide I my rewle upon this forseide 13 day, and fond the point of my rewle in the bordure upon the firste degre of Capricorne a lite within the degre. And than had I of this conclusioun the ful experience.
2. To knowe the altitude of the sonne or of othre celestial bodies.
Put the ryng of thyn Astrelabie upon thy right thombe, and turne thi lift syde ageyn the light of the sonne; and remewe thy rewle up and doun til that the stremes of the sonne shine thorugh bothe holes of thi rewle. Loke than how many degrees thy rule is areised fro the litel crois upon thin est lyne, and tak there the altitude of thi sonne. And in this same wise maist thow knowe by night the alti- tude of the mone or of brighte sterres.
This chapitre is so generall evere in oon that there nedith no more declaracioun; but forget it not.
3. To knowe every tyme of the day by light of the sonne; and every tyme of the nyght by the sterres fixe; and eke to knowe by nyght or by day the degre of eny signe that ascendith on the est orisonte, which that is clepid comounly the ascendent, or ellis horoscopum.
Tak the altitude of the sonne whan the list, as I have seid, and set the degre of the sonne, in caas that it be beforn the myddel of the day, among thyn almykanteras on the est syde of thin Astrelabie; and if it be after the myddel of the day, set the degre of thy sonne upon the west syde. Take this manere of settyng for a general rule, ones for evere. And whan thou hast set the degre of thy sonne upon as lo many almykanteras of height as was the altitude of the sonne taken by thy rule, ley over thi label upon the degre of the sonne; and than wol the point of thi labell sitte in the bordure upon the verrey tyde of the day.
Ensample as thus: -The yeer of oure lord 1391, the 12 day of March, I wolde knowe the tyde of the day. I tok the altitude of my sonne, and fond that it was 25 degrees and 30 of minutes of height in the bordure on the bak side. Tho turned I myn Astrelabye, and by cause that it was beforn mydday, I turned my riet and sette the degre of the sonne, that is to seyn the first degre of Aries, on the right side of myn Astrelabye upon 25 degrees and 30 mynutes of height among myn almykanteras. Tho leide I my label upon the degre of my sonne, and fond the point of my label in the bordure upon a capital lettre that is clepid an X. Tho rekned I alle the capitale lettres fro the lyne of mydnight unto this forseide lettre X, and fond that it was 9 of the clokke of the day. Tho loked I doun upon the est orizonte, and fond there the 20 degre of Geminis ascendyng, which that I tok for myn ascendent. And in this wise had I the experience for evermo in which manere I shulde knowe the tyde of the day and eke myn ascendent.
Tho wolde I wite the same nyght folewyng the houre of the nyght, and wroughte in this wise: - Among an heep of sterres fixe it liked me for to take the altitude of the faire white sterre that is clepid Alhabor, and fond hir sittyng on the west side of the lyne of midday, 12 degrees of heighte taken by my rewle on the bak side. Tho sette I the centre of this Alhabor upon 12 degrees among myn almykanteras upon the west side, by cause that she w as founde on the west side. Tho leyde I my label over the degre of the sonne, that was discendid under the west orisounte, and rekned all the lettres capitals fro the lyne of midday unto the point of my Iabel in the bordure, and fond that it was passed 9 of the c lokke the space of 10 degrees. Tho lokid I doun upon myn est orisounte, and fond there 10 degrees of Scorpius ascendyng, whom I tok for myn ascendent. And thus lerned I to knowe onys for evere in which manere I shuld come to the houre of the nyght, and to myn ascendent, as verrely as may be taken by so smal an instrument.
But natheles this rule in generall wol I warne the for evere: - Ne make the nevere bold to have take a just ascendent by thin Astrelabie, or elles to have set justly a clokke, whan eny celestial body by which that thou wenyst governe thilke thinges be nigh the south Iyne. For trust wel, whan the sonne is nygh the meridional lyne, the degre of thc sonne renneth so longe consentrik upon the almykanteras that sothly thou shalt erre fro the just ascendent. The same conclusion sey I by the centre of eny sterre fix by nyght. And more over, by experience I wot wel that in our orisounte, from xi of the clokke unto oon of the clokke, in taking of a just ascendent in a portatif Astrelabie it is to hard to knowe - I mene from xi of the clokke before the houre of noon til oon of the clokke next folewyng.
Rough translation of the above three instructions from Part 2 of Chaucer’s treatise:
1. To find the degree in which the sun is day by day after his course:
Put your rule upon the day you wish to know the degree for it will tell you what degree the sun is in. For example if I wanted to know the degree of the sun on March 12, 1391 I would look on the back half of my astrolabe and on the circle of dates find the March 12 and move the point of my rule to that date and see that the point is almost to the first degree of Aries and thus I know what degree the sun is in for this day.
2. To know the altitude (height) of the sun or of other celestial bodies:
Put the ring of your astrolabe on your right thumb and turn toward the light of the sun. Adjust the rule up and down until the sun’s rays shine through both holes of the rule. Look then how many degrees your rule is arced from the little cross on the east line and take from this the altitude of the sun. By night you can know the altitude of the moon or bright stars in the same way.
3. To know the time of the day by the light of the sun, and the time of night by the fixed stars, and also to know by night or day the degree of any sign that ascends on the east horizon which is commonly called the ascendant or "ellis horoscopum":
Take the altitude of the sun in the way I have described in #2 and set the degree of the sun on the almucantars on the east side of your astrolabe if it is before noon and one the west side if it is afternoon. Make this habit of setting the degree a general rule for you once and for all. And when you have set the degree of your sun on the almucantars and the altitude is set by the rule put your over the degree of the sun and then the point of this label will sit on the mark of the time of day. For example - The year of our lord 1391, the 12th day of March I would know the time of the day. I took the altitude of my sun and found tha it was 25 degrees and 30 minutes of the height of in the border on the backside. I turned my astrolabe and because it was before noon, I turned my rete and set the degree of the sun to 25 degree and 30 minutes of height on my almucantars (that is to say the first degree of Aries) on the right side of my astrolabe. So I laid my label upon the degree of the sun and found the point of my label on the border of the marking with a capital X. I counted all the letters from the line of midnight to this letter X and found that there were 9 of them, so it was 9 o’clock in the day. I then looked at the line of the east horizon and saw that it indicated 20 degrees of Gemini, which is what my ascendant is. And so in this way I was able to find the time of day and the ascendant for the day. An example for the night is this: I picked among the fixed stars a very bright one called Alhabor and found that it sat on the west side of midday at 12 degrees of height as taken by rule on the back side. It was also found to sit on 12 degrees on my almucantars on the west side. I laid my label over the degree if the star and again found the letter to which my label pointed to and saw that it was passed 9 o’clock by 10 degrees. I also looked down my east horizon and saw that 10 degree of Scorpio was ascending, which is my ascendant. And so I was able to find the time of night from this very small instrument. Although this rule generally works, I will make a warning - never trust a measurement you take when the body you are looking at is along the south "Iyne" for when the sun is along this line it remains still for so long that there will be error in your reading and also for your ascendant. Also from experience it is hard to take readings from 9pm to about noon.
There are 46 instructions for the astrolabe in Part 2 of Chaucer’s treatise. They range from finding the altitude of a celestial body to finding the correct date and time, to finding the latitude of a city to finding where North, South, East or West it, to finding which house a zodiac sign is rising into. The instructions Chaucer gives are extremely "hand-on" and quite difficult to reproduce without actually having an astrolabe in your hands. Most calculations and instructions are specified for Oxford, England where "Litel Lowys" most likely lives. Oxford, England sits approximately on the 52nd latitude North and at about 1 longitude west of Greenwich. Thus any plates that Chaucer would have used would have been based on this information.
Unfortunately, Chaucer does not continue to do parts 3,4, and 5 of the treatise. He apparently decides to stop, leaving his work unfinished, and thus his treatise on the astrolabe ends...
And thus our own project ends.
Work Cited
Pictures (in order of appearance):
Text:
"A Treatise on the Astrolabe" by Geoffrey Chaucer (F.N. Robinson edition )
http://art-bin.com/art/oastro.html
accessed April 6, 2001
"Proof that a Stereographic Projection of a Circle is a Circle" by Yana Zilberberg Mohanty
accessed March 30, 2001
"Stereographic Projection" by Bill Casselman
Chapter 5 of math 309 text
"Stereographic Projection" by Peter Doyle
http://www.geom.umn.edu/docs/doyle/mpls/handouts/node33.html
accessed April 6, 2001
"The Astrolabe" by J.D. North
Scientific American Journal, Vol: 231,January 1974
pg 96-106
|