Table of Contents
Introduction
Abstract
Proof 1
Proof 2
Conclusion
References
In this presentation I will explain the relationships between the derivatives and areas. More specifically, how we can use derivatives to describe a tangent line on a graph function. And also how the derivative of the area below a function, is the function itself.
Abstract
If we take a point x = p of a function f, the
derivative of this point will define the slope of the tangent line passing
through (p, f(p)).
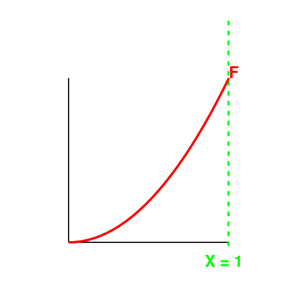
For any function f the area below the height f(x) and above the line x = 0, will form a function F and F' = f will be the derivative of this integral function
Proof 1
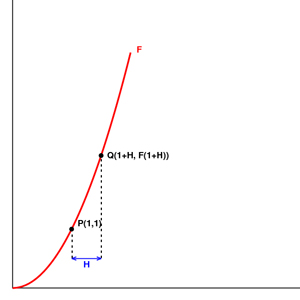
Let f be a function
f(x) = x^2 and P(x, f(x)) be a point on this function

If we draw
a line L through point P(x,f(x)) tangent to this function, and we
can say that the slope of L is the limit
(lim h -> 0) [f(x
+ h) f(x)]/ h where is a small non zero number

For example, lets define P as
the point (1, 1) lets take a non zero h and define a point Q(1+h,
f(1+h))
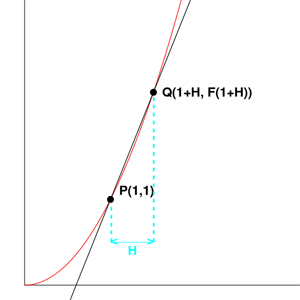
Now lets consider the fact that we
can join these two points in a line PQ, as you can see the line
connecting PQ is not yet tangent with P(1,1) but it is getting
there!
Lets now decrease the non zero number h and decrease it until it is
infinitesimally small (lim h -> 0)
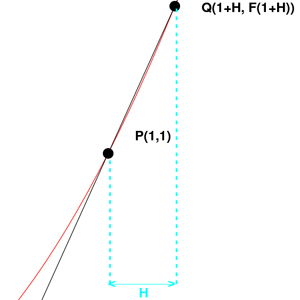

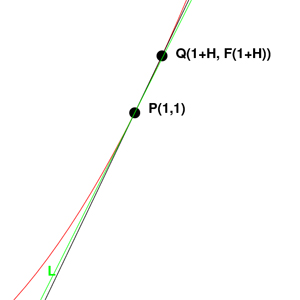
As h becomes
smaller, the point Q will slowly approach P, and the tangent line
will become more apparent, the line L is the true tangent line at
P(1,1) and line to the right of it, is the approximated line PQ
(mathematical explanations in the conclusion)

Consider a function f(x) = x^2 where x
is 0<=x<=1
Using n rectangles, we can approximate the area under this graph. so in this case, the base width of the rectangles will be 1/n and the end points of these rectangles will be defined by i/n. So the height of a rectangle would equate to f(i/n). And with this particular function, f(i/n) = i^2/n^2. Thus the area of one rectangle will be (i^2)/(n^3) (in this example),
Here are various approximations with varying sizes of "n"

n=1
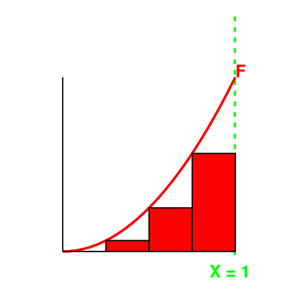
n=3

n=25
Thus by looking at these rectangular approximations, we can determine the area under the graph. (mathematical explanations in conclusion)
The slope of a tangent line on a point P is defined by the limit (lim h -> 0) [f(x + h) f(x)]/ h such that when h becomes smaller, the point Q will merge into P and ultimately cause a tangent line at P(1,1) to be formed (in this case). The more common name for this limit is called the derivative.
The area under the graph is determined by the sum of these n rectangles. Rectangles which have the area of f(Xi) Dx where Dx is the width of a rectangle. Hence if we add up these rectangles we will have the entire area under a function. So ultimately we can say the area A of a rectangle is determined by the integral F =
ňf(Xi) Dx.